Assay & Application Notes
Urease Activity: Kinetic Evaluation with Absorbance 96 Microplate Reader
In collaboration with Munich University of Applied Sciences
Key highlights
- Successful testing of a colorimetric-based assay for monitoring the enzymatic activity of Canavalia ensiform urease.
- No significant differences were detected in the measurement of urease activity between Absorbance 96 and another commercially available microplate reader.
- The study findings confirm Absorbance 96’s capability to accurately quantify urease activity and validate its potential as a robust tool.
Introduction
Colorimetry is one of the most applied analytical chemistry techniques (1) that allows us to determine the concentration of a compound in a solution or the activity of a specific enzyme by measuring spectral absorbance at a particular wavelength (2). Colorimetric assays are usually performed using a colorimeter (spectrophotometer or microplate reader), which typically measures the change in absorbance values (3) of the colored compound formed or restructured during the measurement. Colorimetric assays have many advantages, such as simple analysis procedures, easy and less time-consuming protocols, and lower costs (4). With advances in the development of sensitive colorimeters and additional reagents, colorimetric assays have become some of the most widely used methods in different research applications.
For instance, urease activity measurements rely on the ammonia concentration produced in a sample. Traditionally, the assay based on the Nessler method was commonly applied to determine urease activity. However, this assay required toxic mercury-containing reagents and involved labor-intensive and uneconomical processes. To overcome the hazards of the Nessler method, new quantitative colorimetric assays are being developed, and these have been reported to be as sensitive as the traditional methods (5-7). Some of them use principles such as the ones applied in the Stuart urease test, which is based on measuring color change due to alkalization of the medium, catalyzed by the urease enzyme, using phenol red as an indicator.
In this application note, a comparative study between Absorbance 96 and SpectraMax iD3 was conducted to measure and monitor urease activity. A novel and established colorimetric assay method, developed by Okyay and Rodriguez et al., was used to determine the enzymatic activity of Canavalia ensiform urease (also known as jack bean). The results demonstrated that the Absorbance 96 microplate reader is well-suited for Stuart's urease test method, and its measurement capability is comparable to other microplate readers in the market. Additionally, these findings highlighted the effectiveness of such colorimetric assays in evaluating urease activity.
Results
Absorbance 96 effectively measures urease activity
Urease activity is proportional to the rate of color-change of phenol red, which is determined by measuring absorbance over a period of time. Therefore, absorbance measurements were conducted with Absorbance 96 and SpectraMax iD3 microplate readers for comparison. After monitoring the absorbance kinetics from a dilution series of Canavalia ensiform urease with each microplate reader, standard curves were plotted expressing the rate of color change as a function of Canavalia Ensiform urease enzyme activity (Fig. 1 represents the measurements done on Absorbance 96 and Fig. 2 represents the measurements conducted by SpectraMax iD3). The results obtained in both the standard curves showed a high level of similarity. Additionally, upon comparing the fitting curves, the coefficient of determination (R2) exceeded 0.99 in both cases, indicating that the calibration curves do not differ regarding the linearity of the measurement. In the curve equation, the 'y' refers to the rate of color change, and the 'x' corresponds to the urease activity of the Canavalia ensiform samples, and the equation is used to calculate the value of the urease activity.
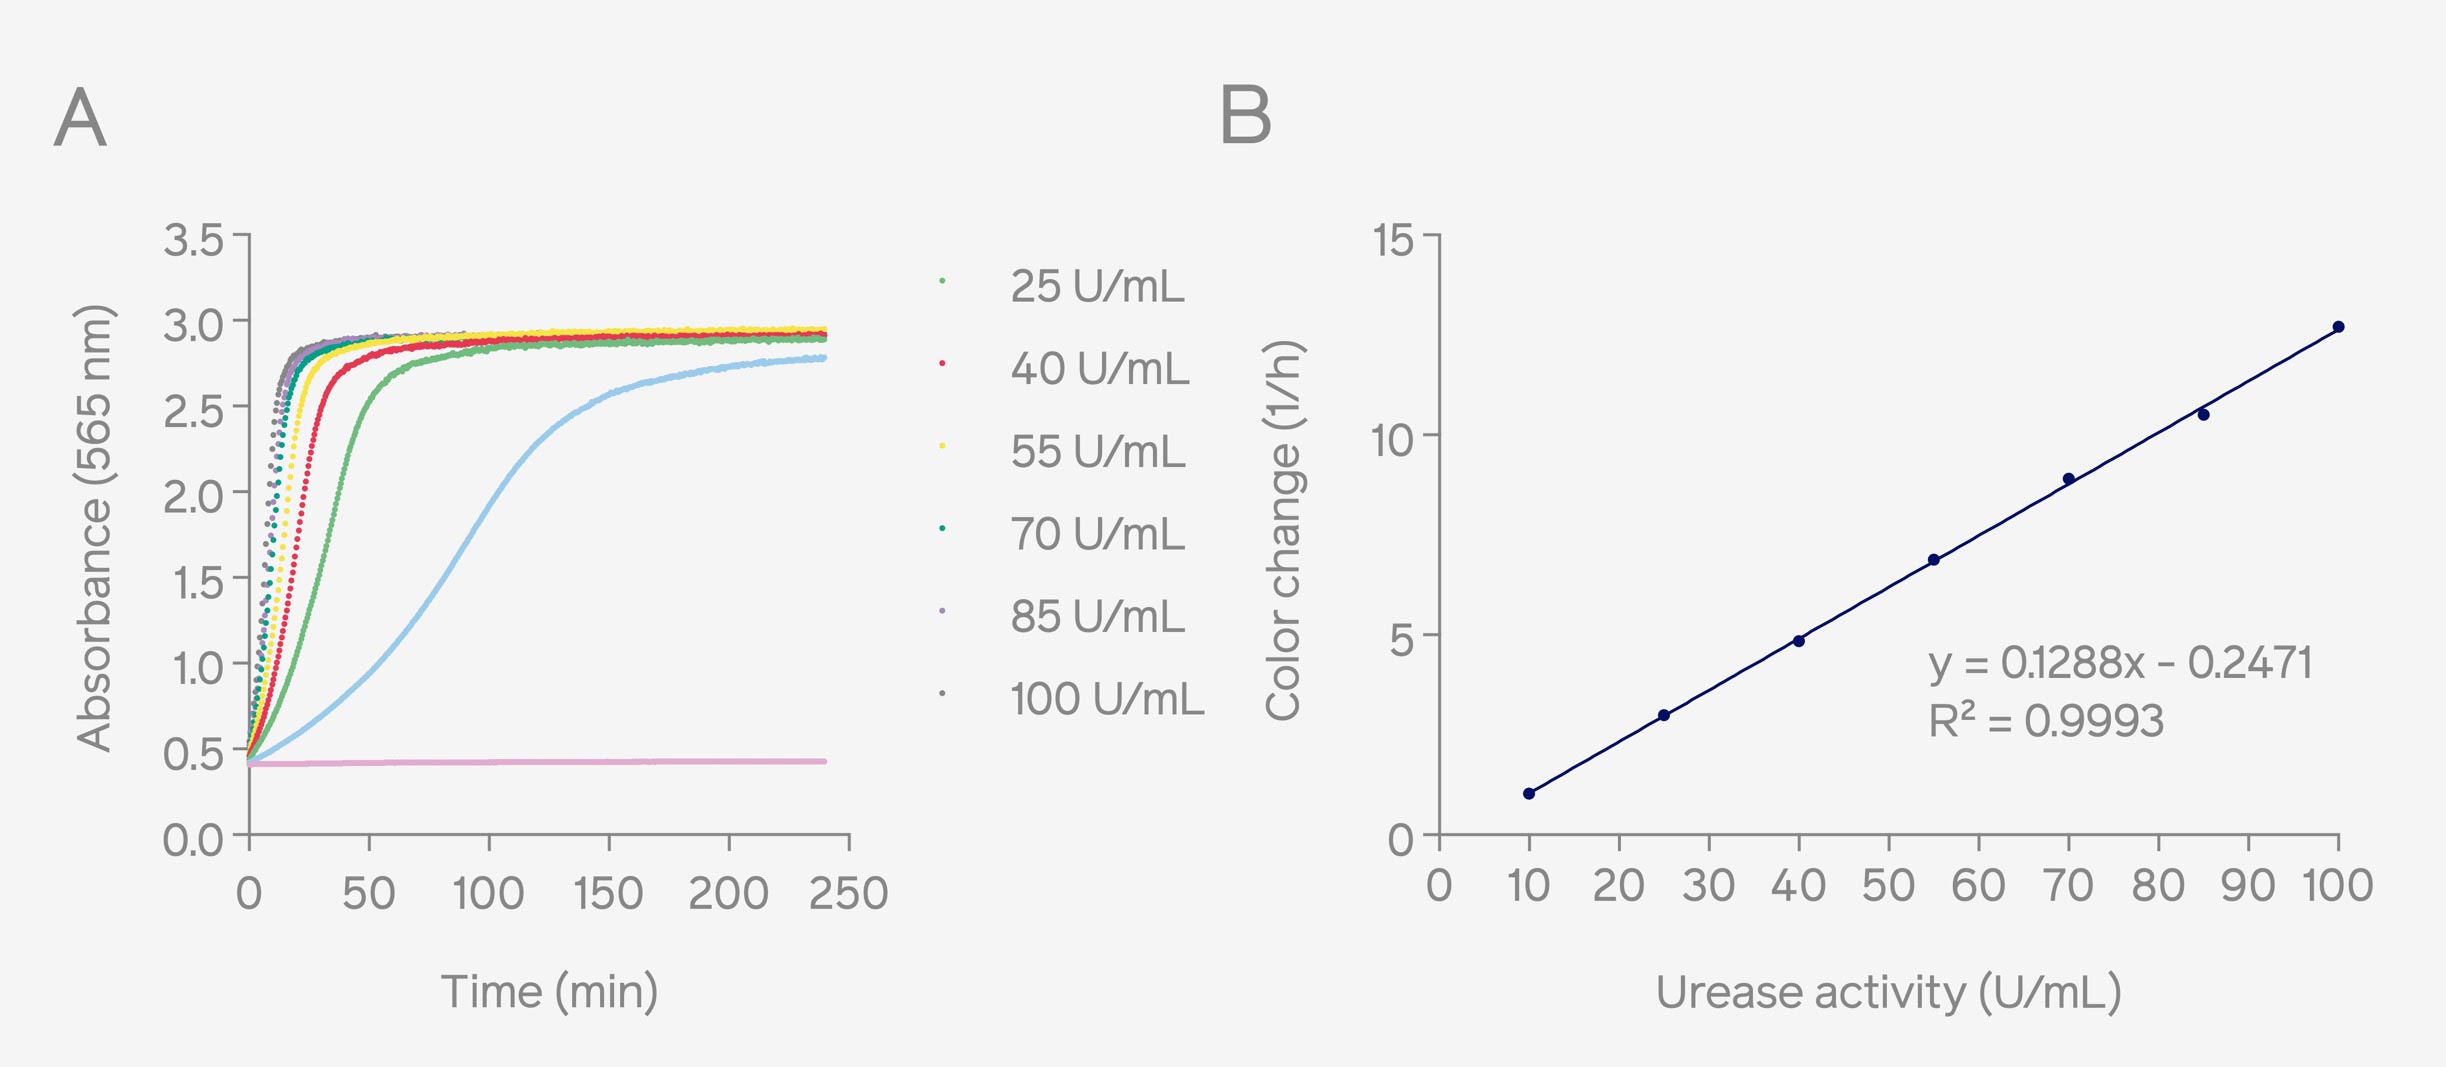
Figure 1: Absorbance curves of urease activity (U/mL) in Stuart’s broth measured at 562 nm by Absorbance 96 (A). Corresponding standard curve based on the color change rates and urease activities (10 – 100 U/mL), the color change rate was calculated by determining the maximum slope of the sigmoidal curve (B).
Based on the highly consistent outcomes observed between the results obtained from the two distinct standard curves generated using different microplate readers, it can be inferred that the utilization of Absorbance 96 is equally suited to quantifying urease activity when compared to the SpectraMax iD3 microplate reader. Additionally, since two different 96-well plates with different samples were used for measuring absorbance with Absorbance 96 and SpectraMax iD3, these standard curves can only be compared relatively, not absolutely.
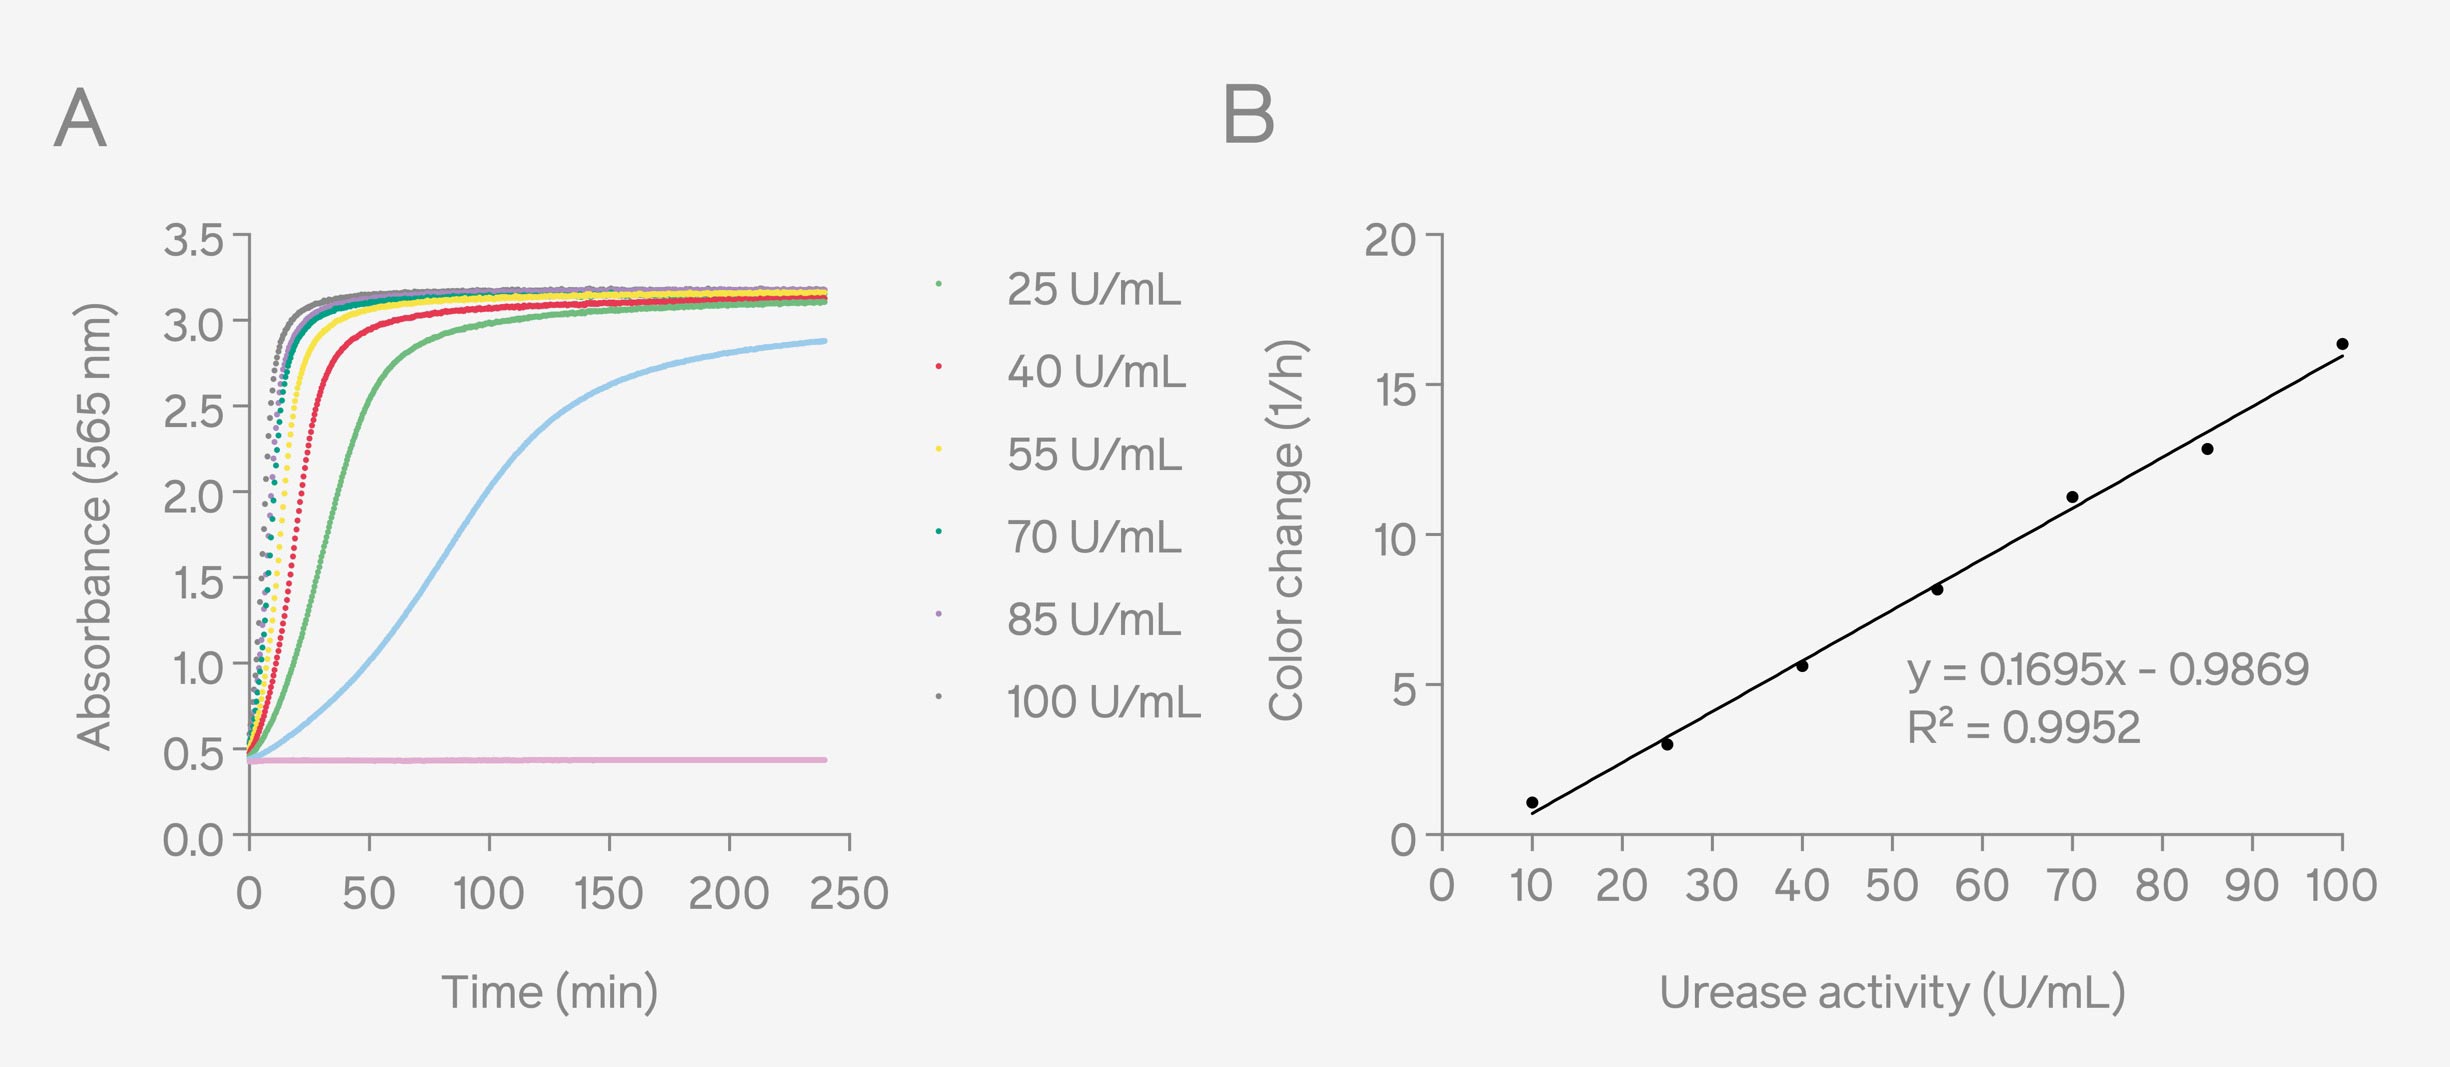
Figure 2: Absorbance curves of urease activity (U/mL) in Stuart’s broth measured at 562 nm by SpectraMax iD3 (A). Corresponding standard curve based on the color change rates and urease activities (10 – 100 U/mL), the color change rate was calculated by determining the maximum slope of the sigmoidal curve (B).
Discussion
After comparing the measurements and subsequent determination of the standard curve for examining the enzymatic activity of Canavalia ensiform urease, measurements done with Absorbance 96 showed linearity in data that agrees well with the expected outcome with SpectraMax iD3. Therefore, this study provides compelling evidence supporting the effective use of the Absorbance 96 microplate reader for conducting colorimetric-based urease activity tests.
Additionally, this study suggests that the colorimetric method developed by Okyay and Rodriguez et al. could be an effective alternative for accessing urease activity, potentially circumventing the need to handle toxic reagents in future investigations. Furthermore, the economic advantages associated with the accessibility and cost-effectiveness of readily available colorimetric reagents represent a significant benefit.
Materials and Experimental Outline
Colorimetric assay for rapid urease activity quantification
To measure the urease enzyme activity, an experimental protocol using phenol red as a colorimetric indicator was conducted (4). The samples of Canavalia ensiform urease were prepared in Stuart's urease broth medium to distinguish urease-positive and urease-negative bacteria (8,9). This medium contained phenol red, a pH indicator that changes from yellow-orange to pink-red according to the alkalinization of the media. The mechanism of Stuart's broth depends upon the hydrolysis reaction catalyzed by the urease enzyme. Bacteria capable of producing hydrolysis of urea can produce enough basic ammonia and carbon dioxide as by-products. The produced ammonia further protonates into ammonium and hydroxyl ions which causes alkalinity of the medium, thereby increasing the pH of the medium and inducing the colorimetric shift of phenol red. This color change rate (h–1) can be measured by the difference in absorbance detected within the samples and is directly proportional to the urease activity (6, 9,8). Therefore, one can calculate the urease activity rate, following the equation: Rate = (Absorbance at t2 - Absorbance at t1)/(t2-t1), t1 and t2 are the two different time points where different absorbance measurements were taken.
Sample preparation and kinetic absorbance measurement
To compare the capabilities of Absorbance 96 and SpectraMax iD3 microplate reader, a dilution series of Canavalia ensiform (urease, Canavalia Ensiform, 10 kU, Calbiochem) was first prepared. Therefore,20 µl/well of the respective urease dilution was preloaded into two 96-well microplates (MTP) (Greiner Bio-one, Frickenhausen), and 180 µl of Stuart broth/well was added into it. Then, after manually stirring for 3 seconds, one of the 96-well microplates was inserted in Absorbance 96 microplate reader, and absorbance was measured for 250 minutes with 30-second intervals. The same procedure was immediately applied for absorbance measurement with the SpectraMax iD3.
References
1. Cooper JA, Mintz BR, Palumbo SL, Li WJ. Assays for determining cell differentiation in biomaterials. Charact Biomater. 2013 Jan 1;101–37.
2. Askim JR, Suslick KS. Colorimetric and fluorometric sensor arrays for molecular recognition. Compr Supramol Chem II. 2017 Jan 1;8:37–88.
3. Na HJ, Chung HT, Ha KS, Lee H, Kwon YG, Billiar TR, Kim YM. Chapter 17 Detection and measurement for the modification and inactivation of caspase by nitrosative stress in Vitro and in Vivo. Methods Enzymol. 2008, 441, 317–327.
4. Catherine EH, Edwin CC. Chemistry, An Introduction to Organic, Inorganic and Physical Chemistry: Google Libros.
5. Bzura J, Koncki R. A Mechanized Urease Activity Assay. Enzyme Microb. Technol. 2019, 123, 1–7.
6. Onal OT, Frigi RD. High Throughput Colorimetric Assay for Rapid Urease Activity Quantification. J. Microbiol. Methods 2013, 95 (3), 324–326.
7. Kandeler E, Gerber H. Short-Term Assay of Soil Urease Activity Using Colorimetric Determination of Ammonium. Biol. Fertil. Soils 1988, 6 (1), 68–72.
8. Brink B. Urease Test Protocol - Library Urease Test Protocol Author Information Urease Test Protocol - Library www.asmscience.org.
9. Cui MJ, Teng A, Chu J, Cao B. A Quantitative, High-Throughput Urease Activity Assay for Comparison and Rapid Screening of Ureolytic Bacteria. Environ. Res. 2022, 208, 112738.