Byonoy Basics
OD600 Measurement: 4 Facts and Tips to Know for Bacterial Culture Growth
The determination of the Optical Density (OD) at 600 nm known as OD600 measurement, is the simplest method to estimate the concentration of bacteria in a sample. Due to its ease of use, this method is the most common approach to measuring bacterial growth, with applications ranging from various biological and medical research areas.
Fact 1: OD600 measures light scattering in culture media
OD600 measures the degree of light scattering (600 nm) caused by the presence of particles in a solution or culture media. The more particles (microorganisms) are in the solution, the more light is scattered by them (1,2). The OD600 method determines the portion of the light passing through the suspension of microorganisms (transmitted optical intensity) as shown in the figure below. The amount of transmitted light can be used to calculate the concentration of particles in that solution since the amount of absorbed light by a sample relates to its concentration (Beer-Lambert law) (3,4).
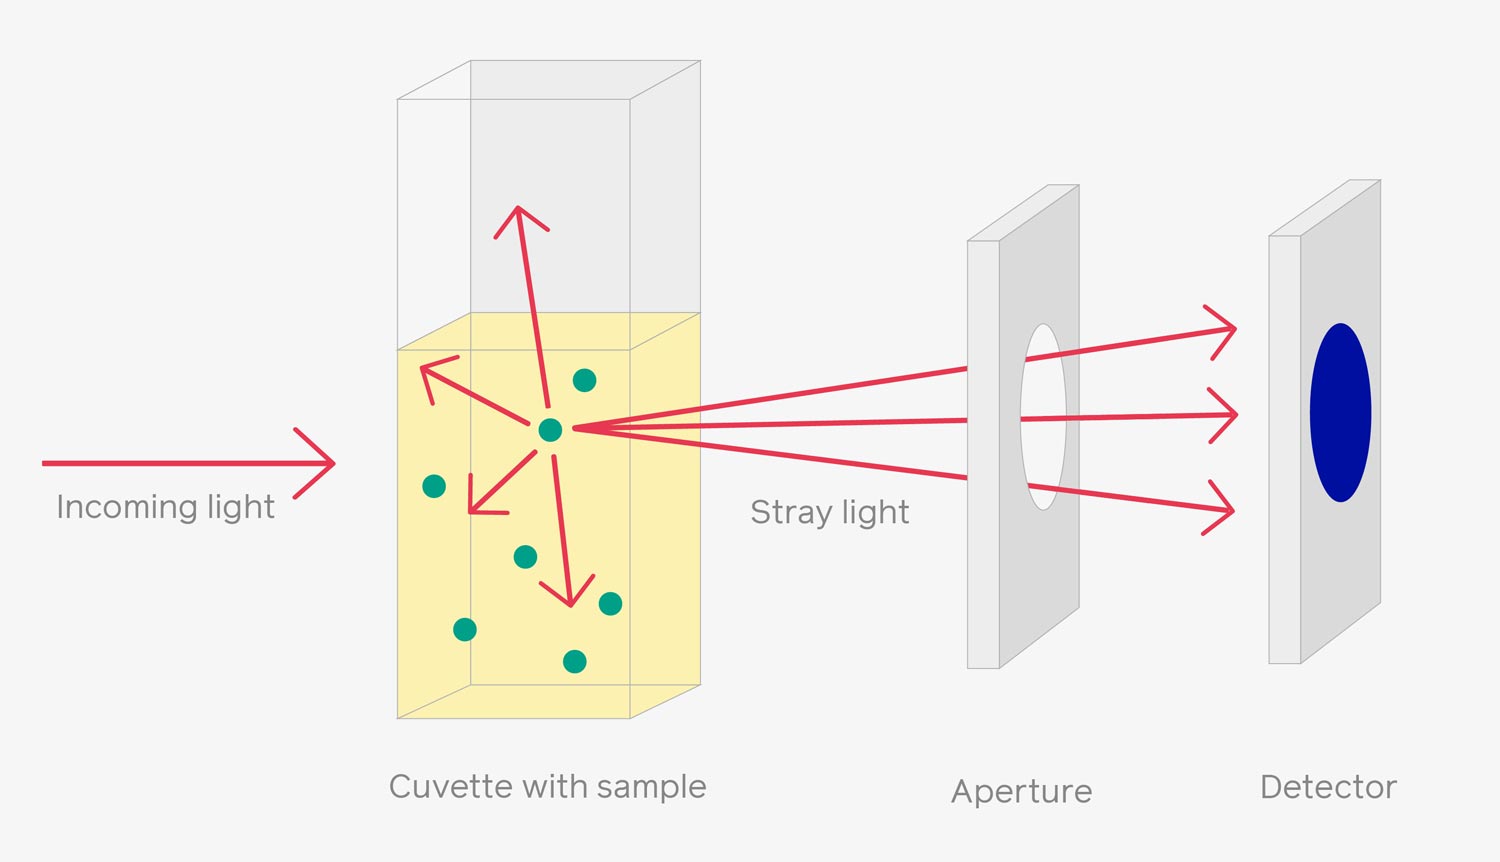
Figure 1: Simple illustration of OD600 measurement
Fact 2: Why it is typically measured at 600 nm?
The 600 nm wavelength is specifically chosen for bacterial OD measurement because it is the known wavelength that is safe and not harmful to bacteria compared to UV wavelengths (5). Additionally, other wavelengths can scatter light when they encounter DNA, RNA, or proteins. Also, at this wavelength absorption in microbial species and organic dissolved matter in water is very small, and only scattering plays a key role.
Fact 3: OD600 measurement determines bacterial culture growth stage
Understanding the bacterial growth phase and its concentration in culture samples has lots of applications ranging from microbial production in food and beverage industries to the development of new antibiotics and synthetic biology. In general, researchers redesign the microorganisms and grow them in culture. After analyzing the growth, bacteria can be harvested at optimal conditions for further characterization and study. Under favorable conditions, bacteria can reproduce rapidly at an exponential rate. In an experimental setup, it is possible to predict the bacterial growth stage by measuring OD600. The logarithmic growth curve represents the number of living bacteria in the population over time. Along this curve, different phases can be described (6,7).
- The lag phase is the initial phase of cell growth where cells are active and adapting to the new environment however, in this period the cells do not divide. During this phase synthesis of RNA, enzymes, and other molecules takes place that will allow bacteria to initiate proliferation in later phases.
- During the exponential or Log phase, the cells start proliferating and cell growth is initiated. In this phase, the cells divide exponentially and the activity across all cells is uniform. Thus, the slope of the growth curve corresponds to the bacterial growth rate.
- The proliferation starts decreasing in the stationary phase due to the depletion of available nutrients and accumulation of waste products. As a result, cell density reaches its maximum density, and the number of cells becomes constant – as cells die, growing new cells replace them.
- The accumulation of waste products and the lack of nutrients raises cell death. In this death phase, the number of alive cells declines exponentially.
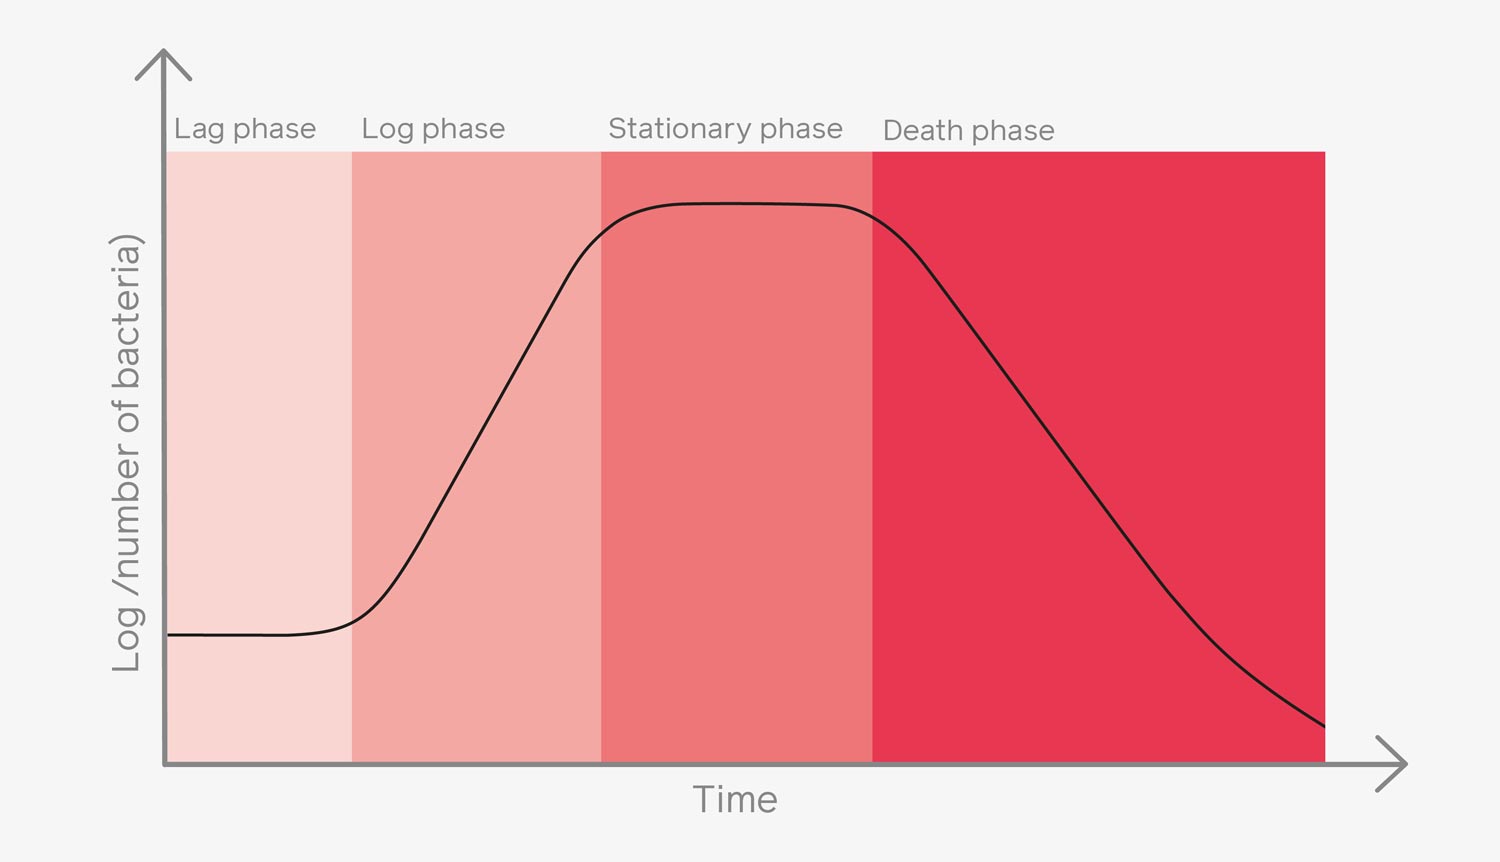
Figure 2: A Graphical representation of various stages of bacterial growth
Fact 4: How to perform OD600 measurements
Typically, a bench-top spectrophotometer is used to measure OD600. A sample (bacterial culture) is placed within a cuvette and inserted in the spectrophotometer. A light source of 600 nm is directed toward the sample – cells present in the sample scatter the light and the transmitted light is detected, which provides a readout. This readout is used to determine/estimate the concentration of bacteria in the sample. To measure the concentration of an unknown bacterial concentration, first standard OD600 calibration curve of known bacterial concentration is generated, and then OD600 values of unknown samples are traced to back-calculate the unknown bacterial concentration. Performing proper calibration is highly crucial to determine the results.
Tips and know-how for OD600 measurements
Tip 1: Check for temperature stability during bacterial culture
Temperature is one of the most crucial factors regulating bacterial growth. At low temperatures, bacterial growth efficiency is reduced compared to higher temperatures ranging from 25 to 30 degrees. Reduced enzyme activities at lower or freezing temperatures can drastically affect bacterial proliferation. In contrast, higher temperatures promote enzyme activity and thus bacterial growth; however, at too high temperatures, enzyme activity decreases due to protein denaturation. Note that each microorganism has its temperature range for optimal bacterial growth (7 – 9).
Tip 2: Mix the samples well before the OD600 measurement
During the bacterial culture, it is crucial to shake the inoculation flask that allows proper mixing of solvents and maintenance of aerobic conditions for optimal oxygen uptake required for bacterial growth (10,11). Also, while taking a bacterial sample out of the culture it is essential to mix it well and take the OD600 measurements immediately to prevent any settlement of cells at the bottom of the cuvette, leading to inaccurate results.
Tip 3: Know the suitability of your bacterial sample
Certain bacteria are not suitable for this method, they are called OD-transparent bacteria as they can significantly transmit light and therefore shows reduced scattering (12). Thus, OD-transparent bacteria are not detected via OD600 measurements. Also, if your bacteria size changes during the growth measurements, one needs to be careful because the size of the particles (e.g., bacteria) can influence OD600 measurements – larger particles scatter more light. Additionally, some bacteria such as Cyanobacteria, and blue-green photosynthetic algae contain chlorophyll and phycocyanin pigments. Due to the presence of these specific pigments, OD measurement at 600 nm can be altered due to absorbance in this region of the light spectrum.
Tip 4: Construct your standard calibration curve
OD600 readout is not an absolute value. It only epresents the amount of light scattered by your bacterial sample however, OD600 measurement reading can be applied to estimate the cell density (cell/mL) in your sample. It is highly recommended to perform dilution experiments with your sample to construct a calibration curve of OD600 vs cells/mL (CFU – colony forming unit). The gradient of the linear portion of the curve represents the conversion factor (cell density in 1 OD unit). Perform standard calibration curves for every different sample and even for different spectrophotometers if used for the OD measurement.
References
1. Stevenson K, McVey AF, Clark IBN, Swain PS, Pilizota T. General Calibration of Microbial Growth in Microplate Readers. Sci. Reports 2016 61 2016, 6 (1), 1–7.
2. Mandelstam J, McQuillen K, Dawes IW. Biochemistry of Bacterial Growth. 1982, p:449.
3. Wenzel T. 1.2: Beer’s Law - Chemistry LibreTexts.
4. Beer C. Bestimmung Der Absorption Des Rothen Lichts in Farbigen Flüssigkeiten. Ann. Phys. 1852, 162 (5), 78–88.
5. Huntress A. OD600 Measurements: An Easy Guide for Researchers Using Bacterial Cultures: bitesizebio.
6. Koseki S, Nonaka J. Alternative Approach to Modeling Bacterial Lag Time, Using Logistic Regression as a Function of Time, Temperature, PH, and Sodium Chloride Concentration. Appl. Environ. Microbiol. 2012, 78 (17), 6103–6112.
7. Peter JJ. Bacterial Metabolism. Med. Microbiol. 1996.
8.14.3: Low Temperatures - Biology LibreTexts
9. Augustin JC, Rosso L, Carlier V. Estimation of Temperature-Dependent Growth Rate and Lag Time of Listeria Monocytogenes by Optical Density Measurements. J. Microbiol. Methods 1999, 38 (1–2), 137–146.
10. Park J, Bansal T, Pinelis M, Maharbiz MM. A Microsystem for Sensing and Patterning Oxidative Microgradients during Cell Culture. Lab Chip 2006, 6 (5), 611–622.
11. Yazdani M. Technical Aspects of Oxygen Level Regulation in Primary Cell Cultures: A Review. Interdiscip. Toxicol. 2016, 9 (3–4), 85.
12. Myers JA, Curtis BS, Curtis WR. Improving Accuracy of Cell and Chromophore Concentration Measurements Using Optical Density. BMC Biophys. 2013 61 2013, 6 (1), 1–16.