Assay & Application Notes
ELISA Assay: Benchmark Performance Analysis of Absorbance 96 ELISA Reader
In collaboration with Enzo Life Sciences
Key Highlights
- The comprehensive comparative analysis revealed no significant difference in performance between the Absorbance 96 ELISA reader and other conventional plate readers.
- Absorbance 96 ELISA reader demonstrates exceptional compatibility with Enzo’s ELISA kits across a wide spectrum.
- The study provides definitive validation of Absorbance 96 as a new category of microplate reader for conducting ELISA assays.
Introduction
Since its implementation, Enzyme-Linked Immunosorbent Assay (ELISA) has become a widespread and highly trusted tool to quantify diverse analytes, from small molecules to quaternary protein complexes. It has become a workhorse for a broad variety of research fields and is widely used for analytic and diagnostic purposes. However, small laboratories and field-based research teams are hampered by the lack of availability of affordable, portable, and low-maintenance ELISA readers.
This application note evaluates and compares the performance of an ultra-compact ELISA reader, Absorbance 96, with other commercially available benchtop microplate readers. To compare both instrument types, a variety of experimental setups have been performed in parallel, using the most common ELISA substrates (TMB – tetramethylbenzidine and pNpp p- Nitrophenylphosphate). This study was conducted in collaboration with Enzo Life Sciences.
Results
To evaluate the performance of the Absorbance 96 ELISA reader for ELISA-based assays, a series of comparative evaluations were conducted using two other commercially available microplate readers - PowerWave XS2 (BioTek Instruments) and SpectraMax 250 (Molecular Devices).
Absorbance 96 ELISA reader showed comparable well-to-well variation
For precision testing, well-to-well variation and value variation of blank-corrected optical density (OD) values across devices were analyzed by measuring a homogenous, pre-developed TMP substrate (Fig. 1). All three devices showed comparable data spread and no statistically significant differences. The Absorbance 96 ELISA reader showed a slightly higher inner quartile range (IQR) as well as extreme spread than the other two devices, but variations of mean and median were comparable between all devices.
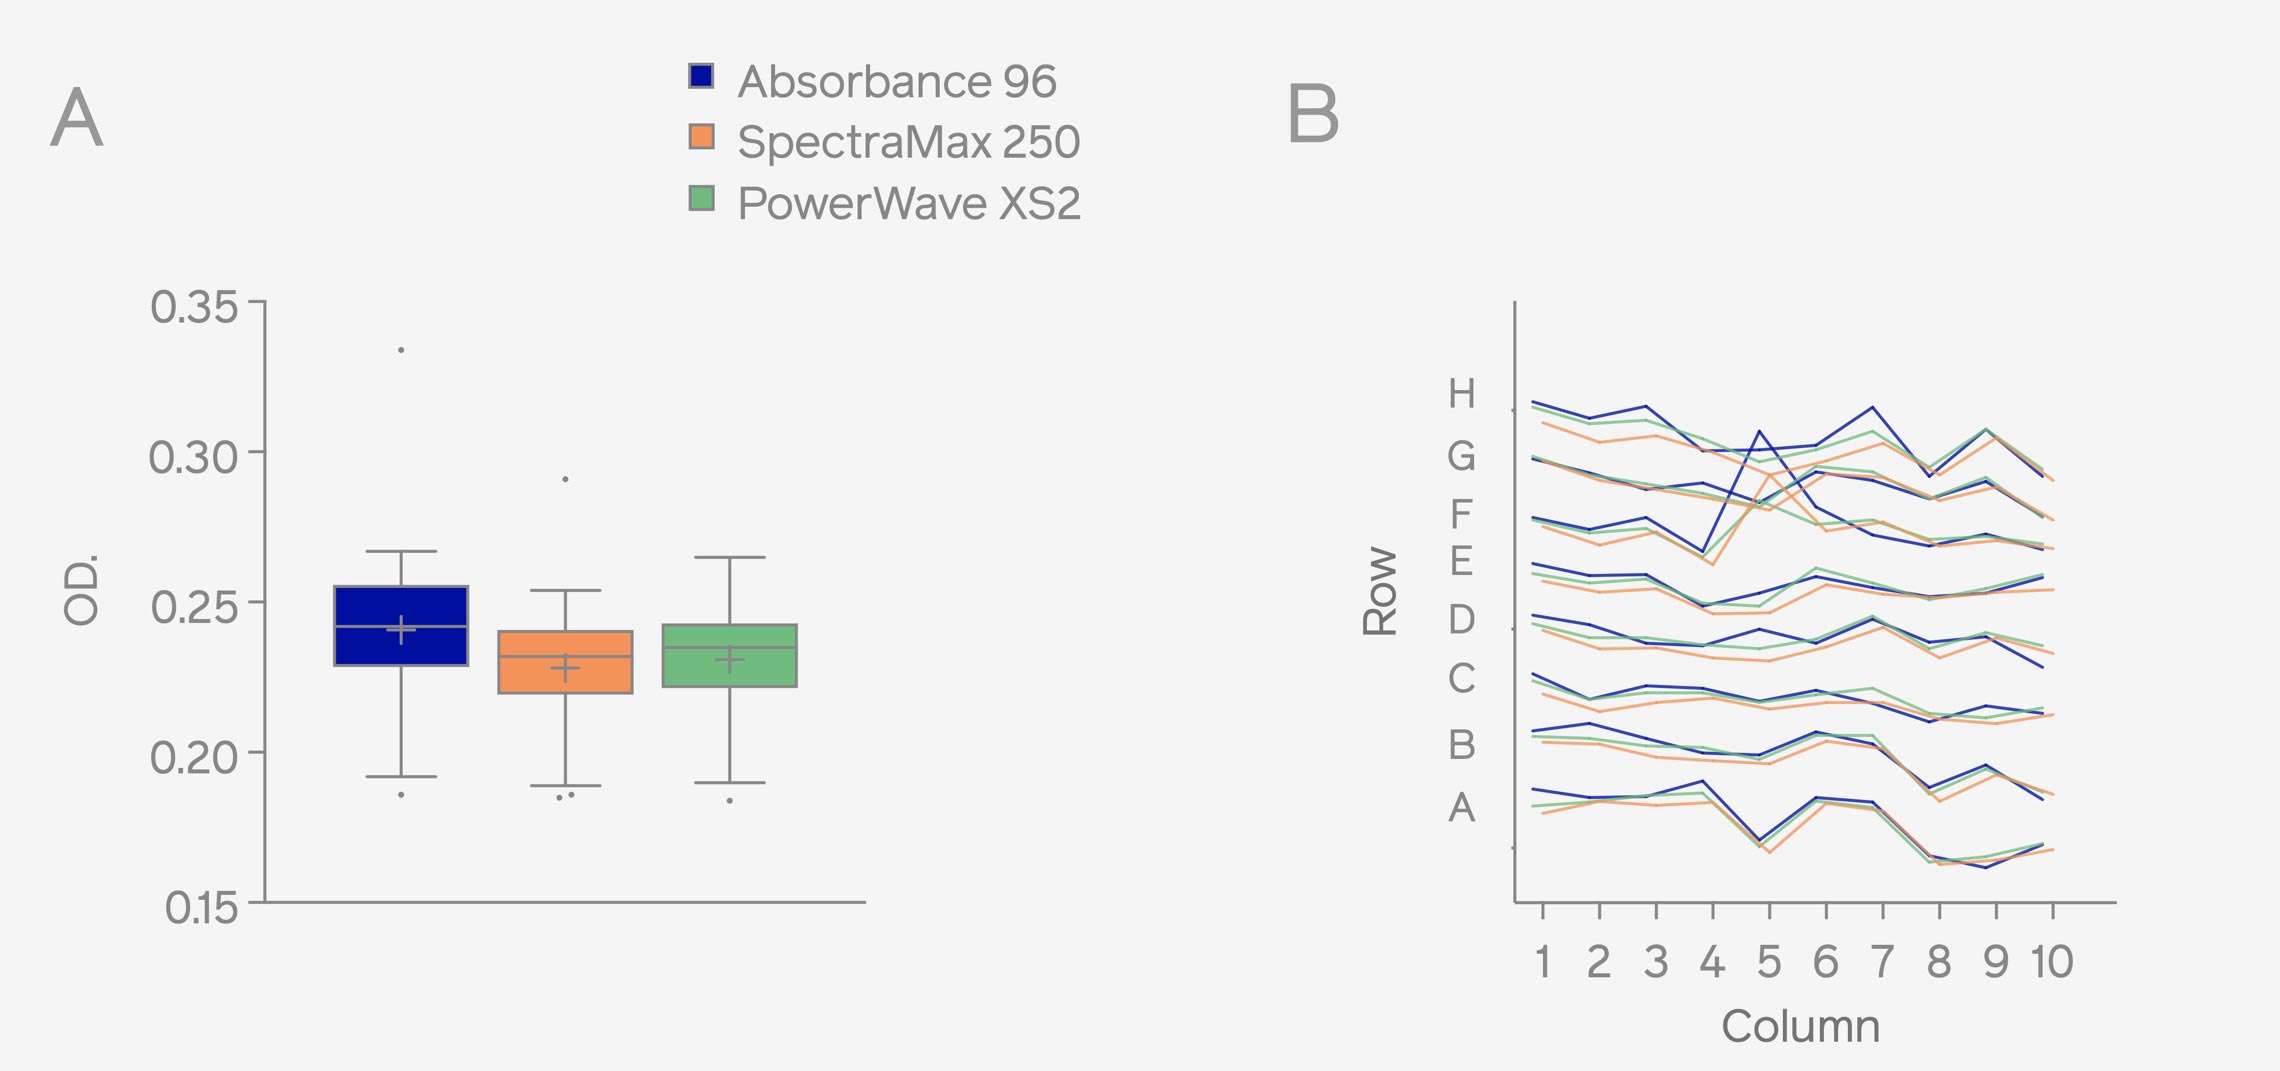
Figure 1: Precision testing. A solution of developed TMB substrate of identical optical density (OD) was pipetted into wells of a microplate and read in three different devices. (A) The variation of wells within each device is depicted as a box-and-whisker plot. (B) Relative OD value change across single rows of the plate for all three devices. The midline shows the median, the box indicates the inner-quartile range (IQR) from the first to the third quartile, the whiskers indicate +/- 1.5xIQR and the dots show outliers.
Overall low and comparable measurement variability was observed
For intra- and inter-measurement variation testing, result variations between duplicates within one measurement with a single device as well as variation of the mean of duplicates as determined with either device were compared and plotted graphically (Fig. 2-5). Variations between two measurements or averages are both depicted as ΔOD as well as %CV because %CV tends to exaggerate minor changes in very low OD values, while ΔOD results in relatively high absolute values for normal changes of high optical densities.
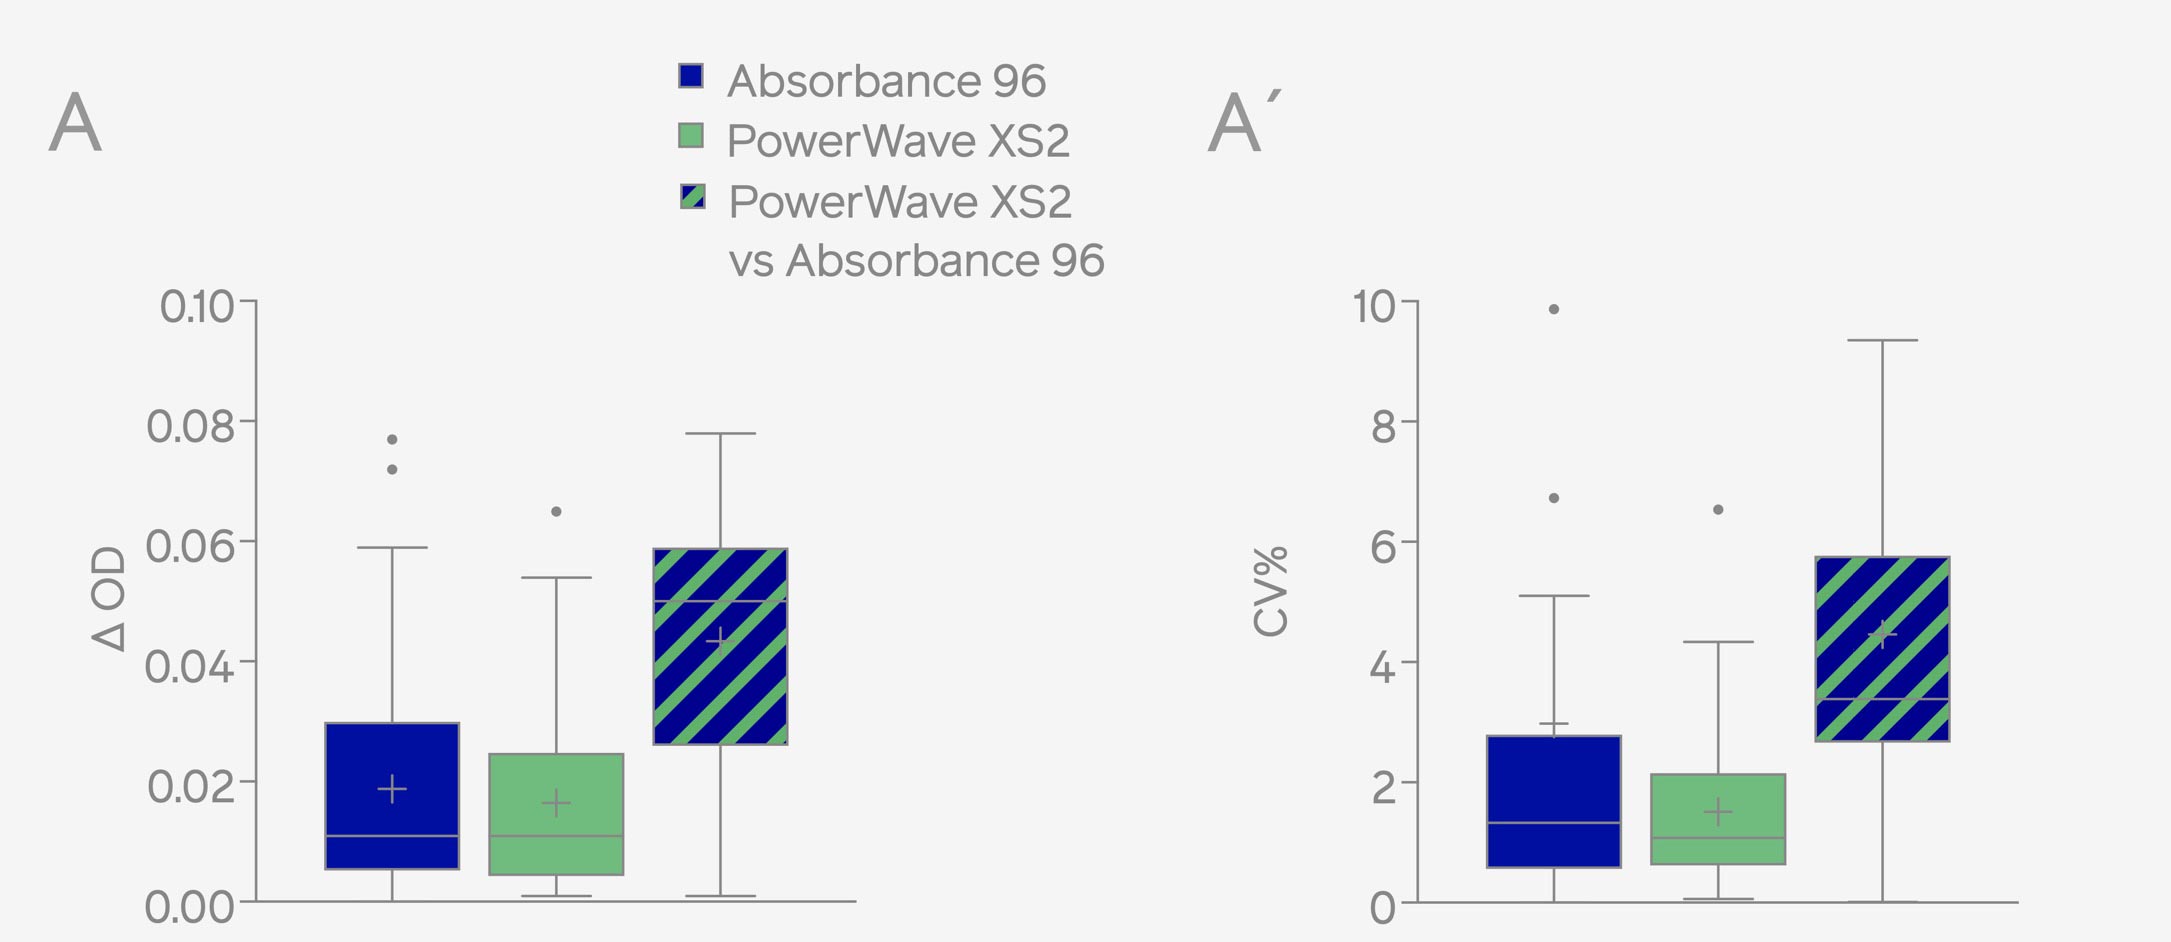
Figure 2: Intra- & inter-measurement testing. IgG2b (mouse) samples were pipetted in duplicates and variation between sample duplicates was determined with either device, as well as variation of the average between both devices. (A/A’) Variations of sample duplicates per device and differences in sample mean between the devices are depicted as (A) ΔOD as well as (A’) %CV. Boxplot data is depicted as a box-and-whisker plot. The midline shows the median, box IQR, whiskers indicate +/- 1.5xIQR, and dots show outliers.
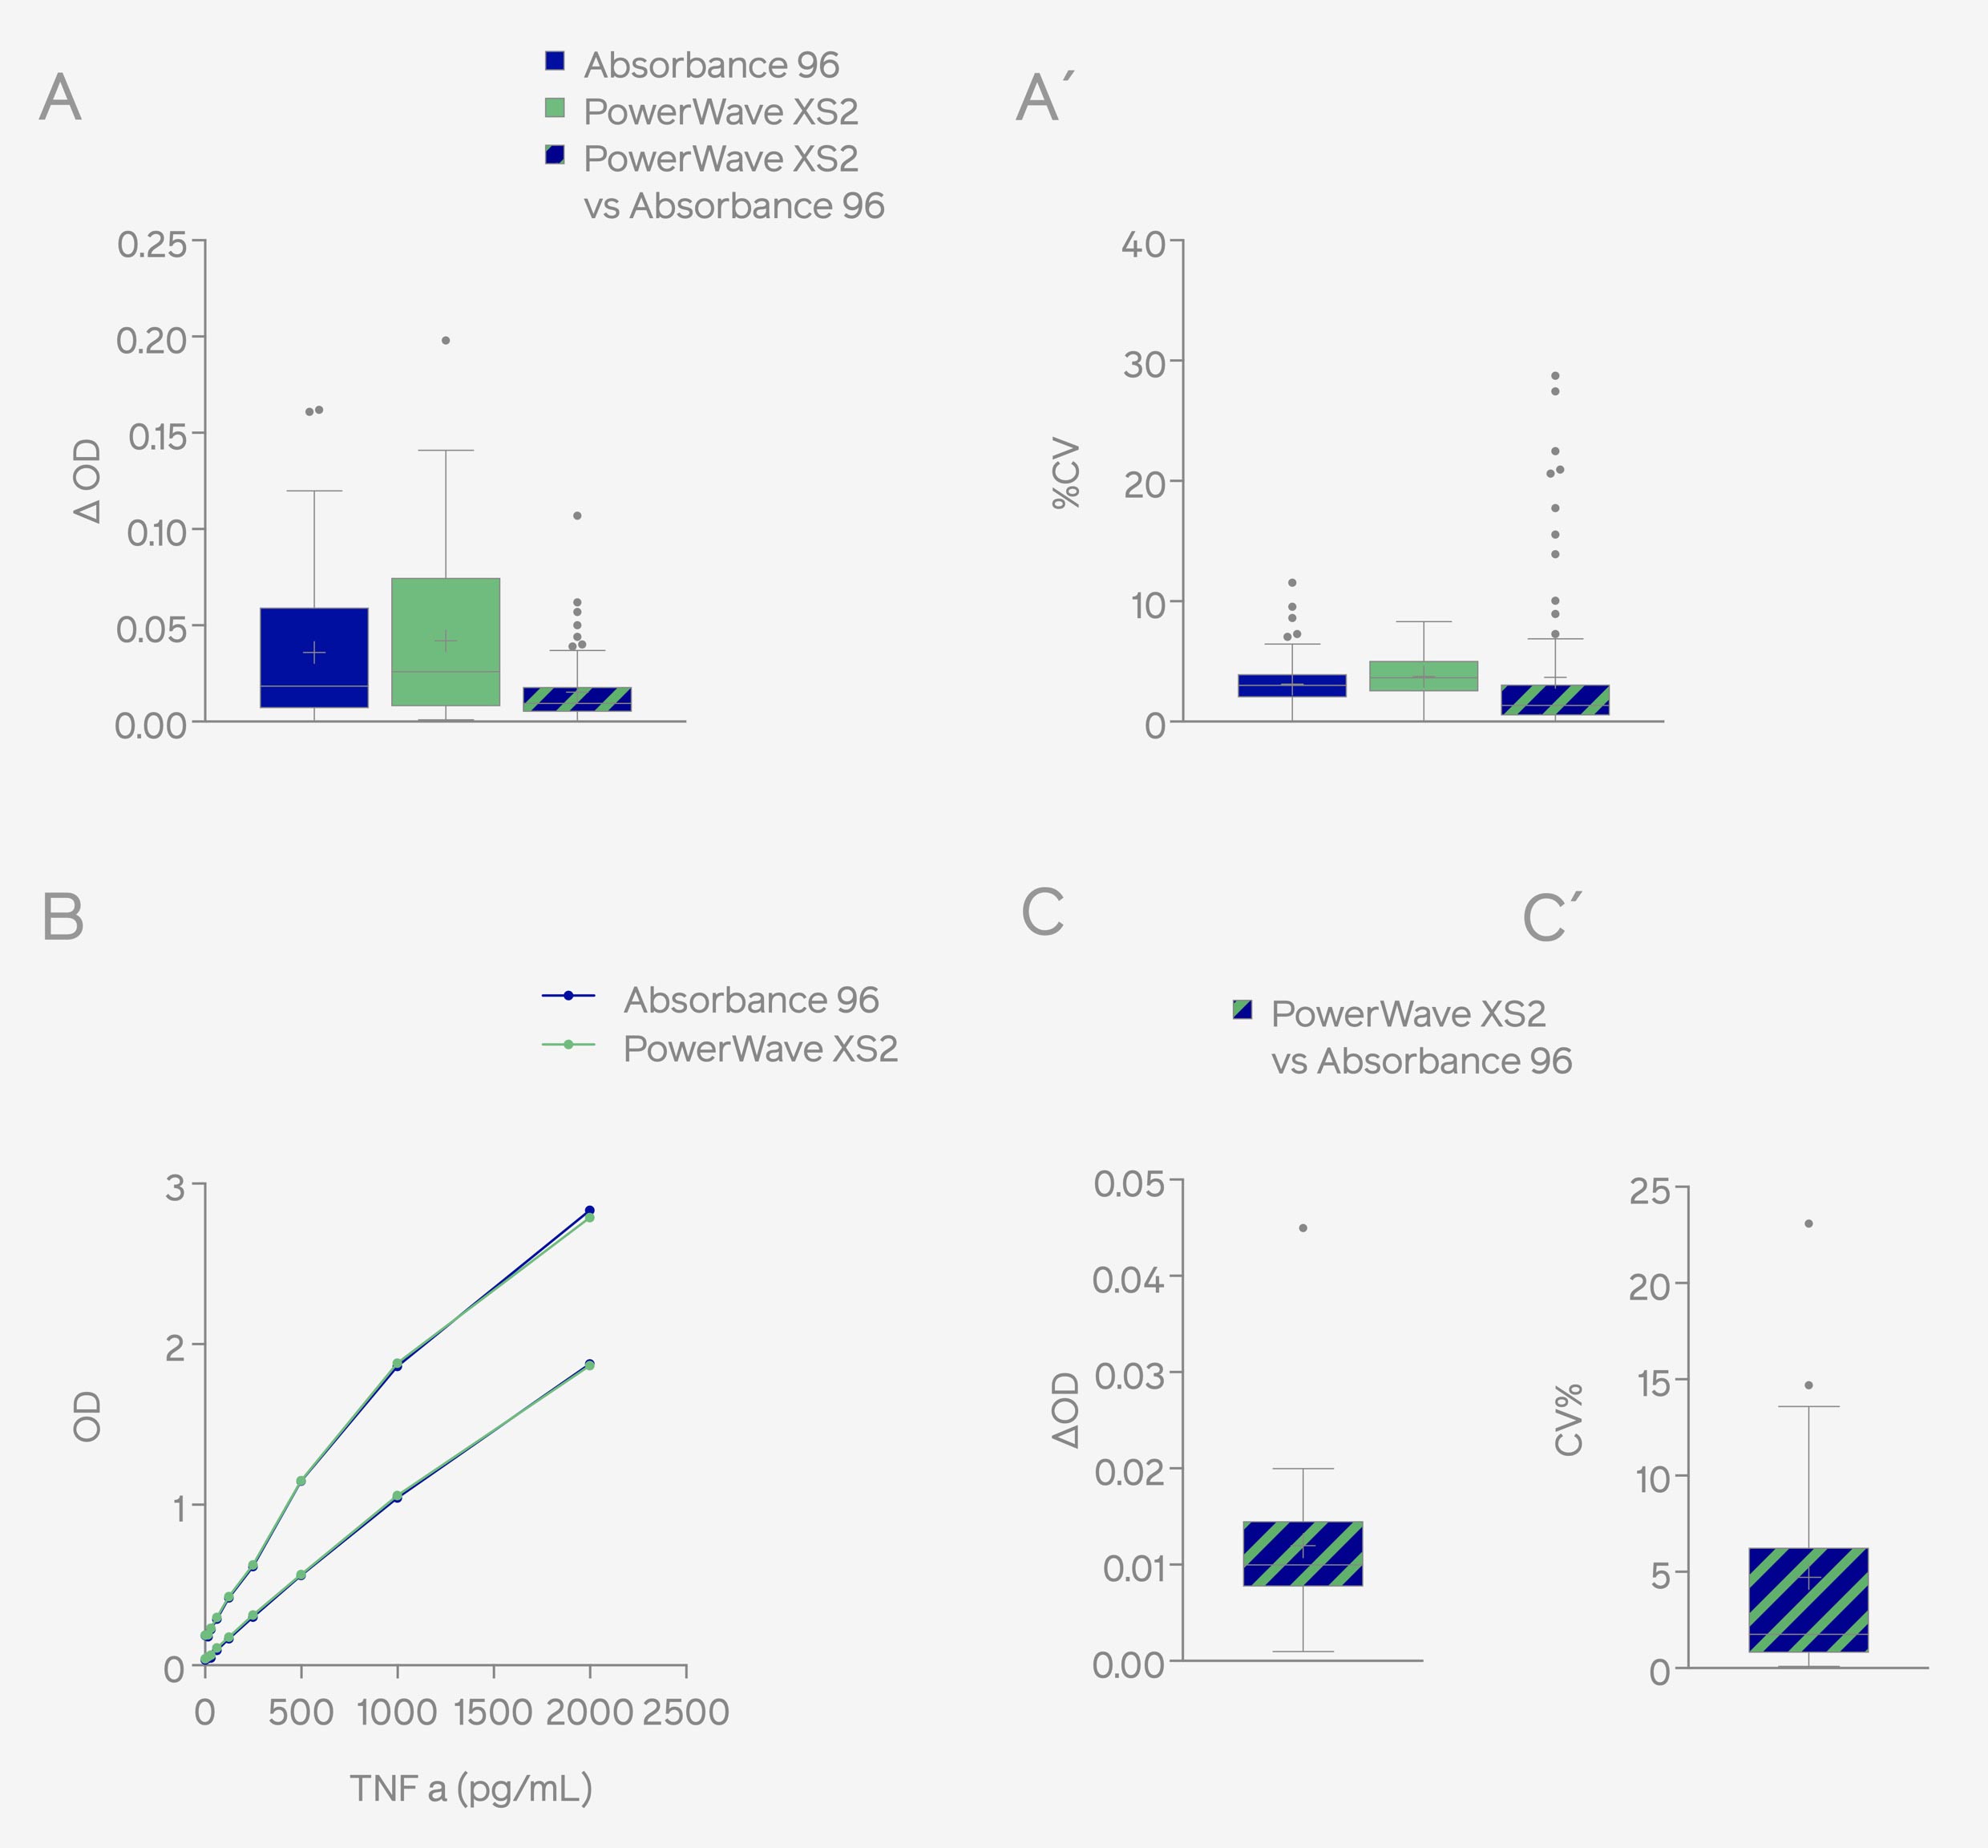
Figure 3: Intra- & inter-measurement testing. TNF-α (mouse) ELISA was carried out and the resulting plates were measured twice with either device. (A/A’) Variation between repetitive reads within one device as well as the variation of the average of two measurements on both devices. Deviation of blank-corrected measurements depicted as (A) ΔOD or (A’) %CV. (B) Two standard curves were generated and measured with either device. Measured OD values are plotted against known standard concentrations. (C/C’) Variations of the obtained standard values between both devices are depicted as (C) ΔOD or (C’) %CV. Boxplot data is depicted as a box-and-whisker plot. The midline shows the median, the box indicates the inner-quartile range (IQR) from the first to the third quartile, the whiskers indicate +/- 1.5xIQR, and the dots show outliers.
The overall variability of measurements was low and at a comparable level between devices. Variations between reads of physical sample duplicates (Fig. 2) were comparable between the Absorbance 96 ELISA reader and PowerWave XS2 plate reader and are likely mainly rooted in physical variation between sample duplicates themselves. Variations between repetitive reads (Fig. 3-4) were comparable for either device, independent of whether TMB or pNpp substrate-based ELISA kits were measured. Differences between the values as determined by either device (Fig. 2-4), as seen by the difference in the mean of repetitive measurements with each device, were at the expected levels. All variations were well within the expected range with the 3rd quartile limit just at or below 5%CV.
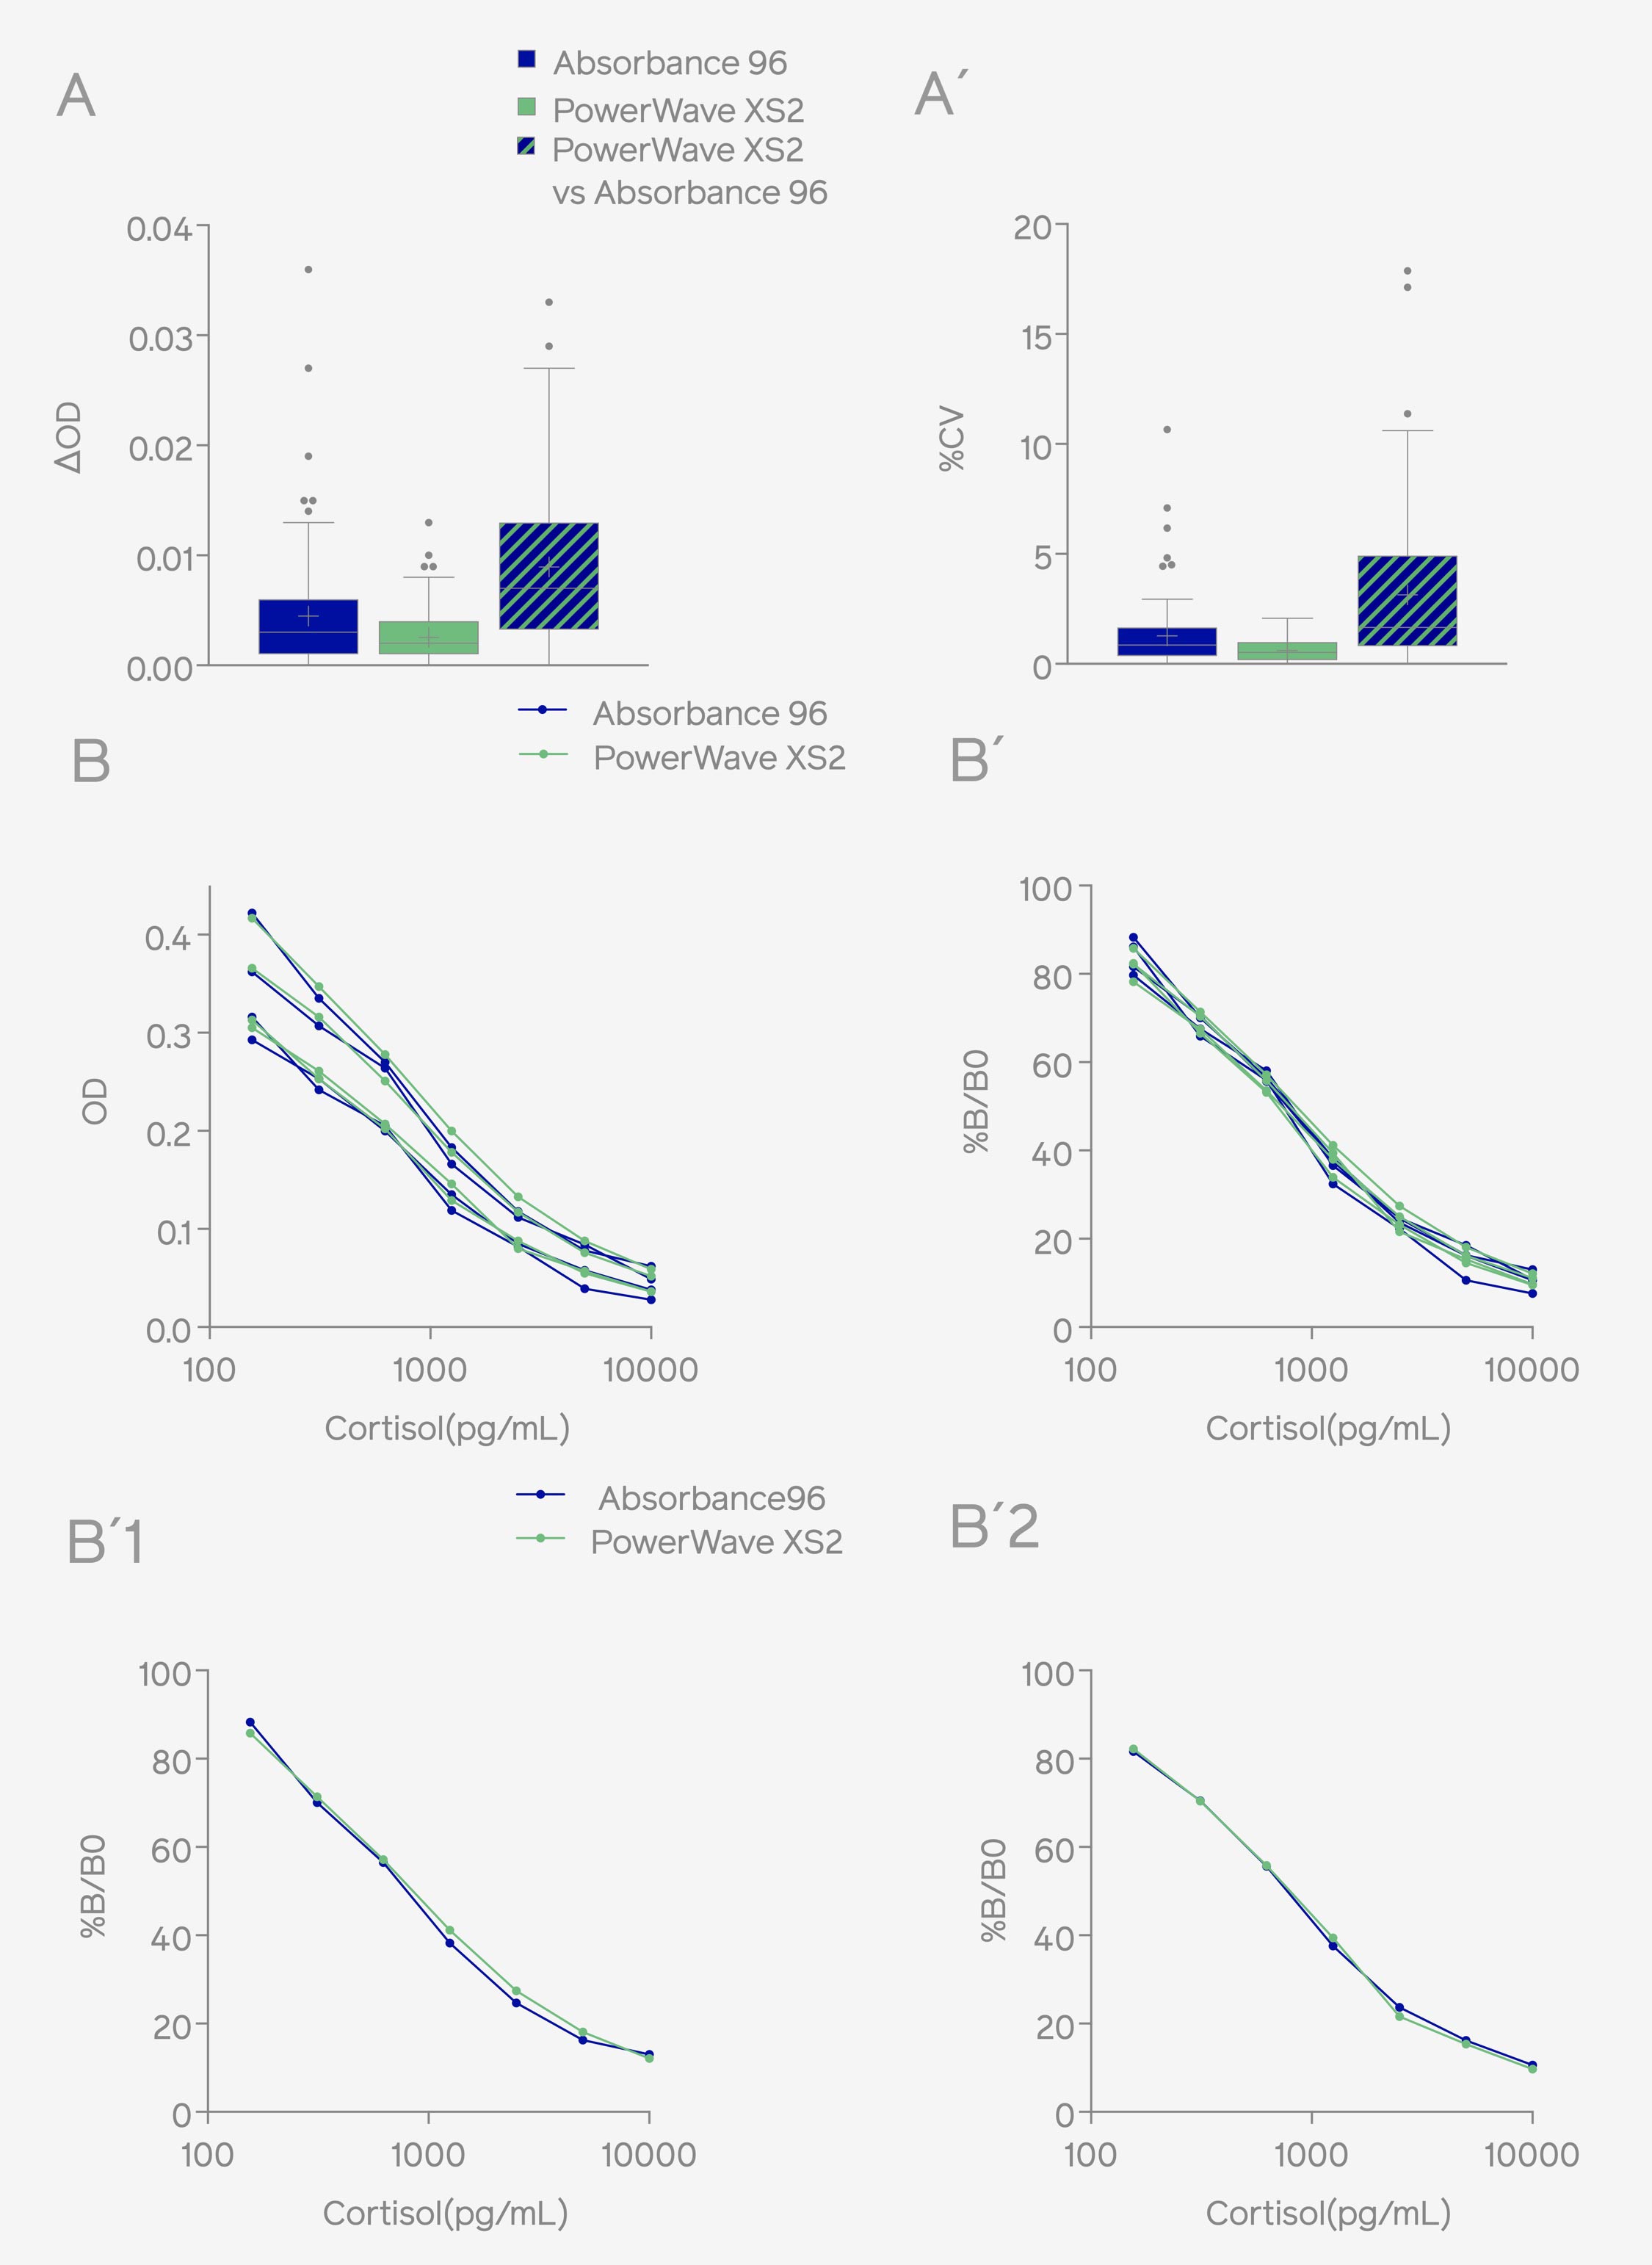
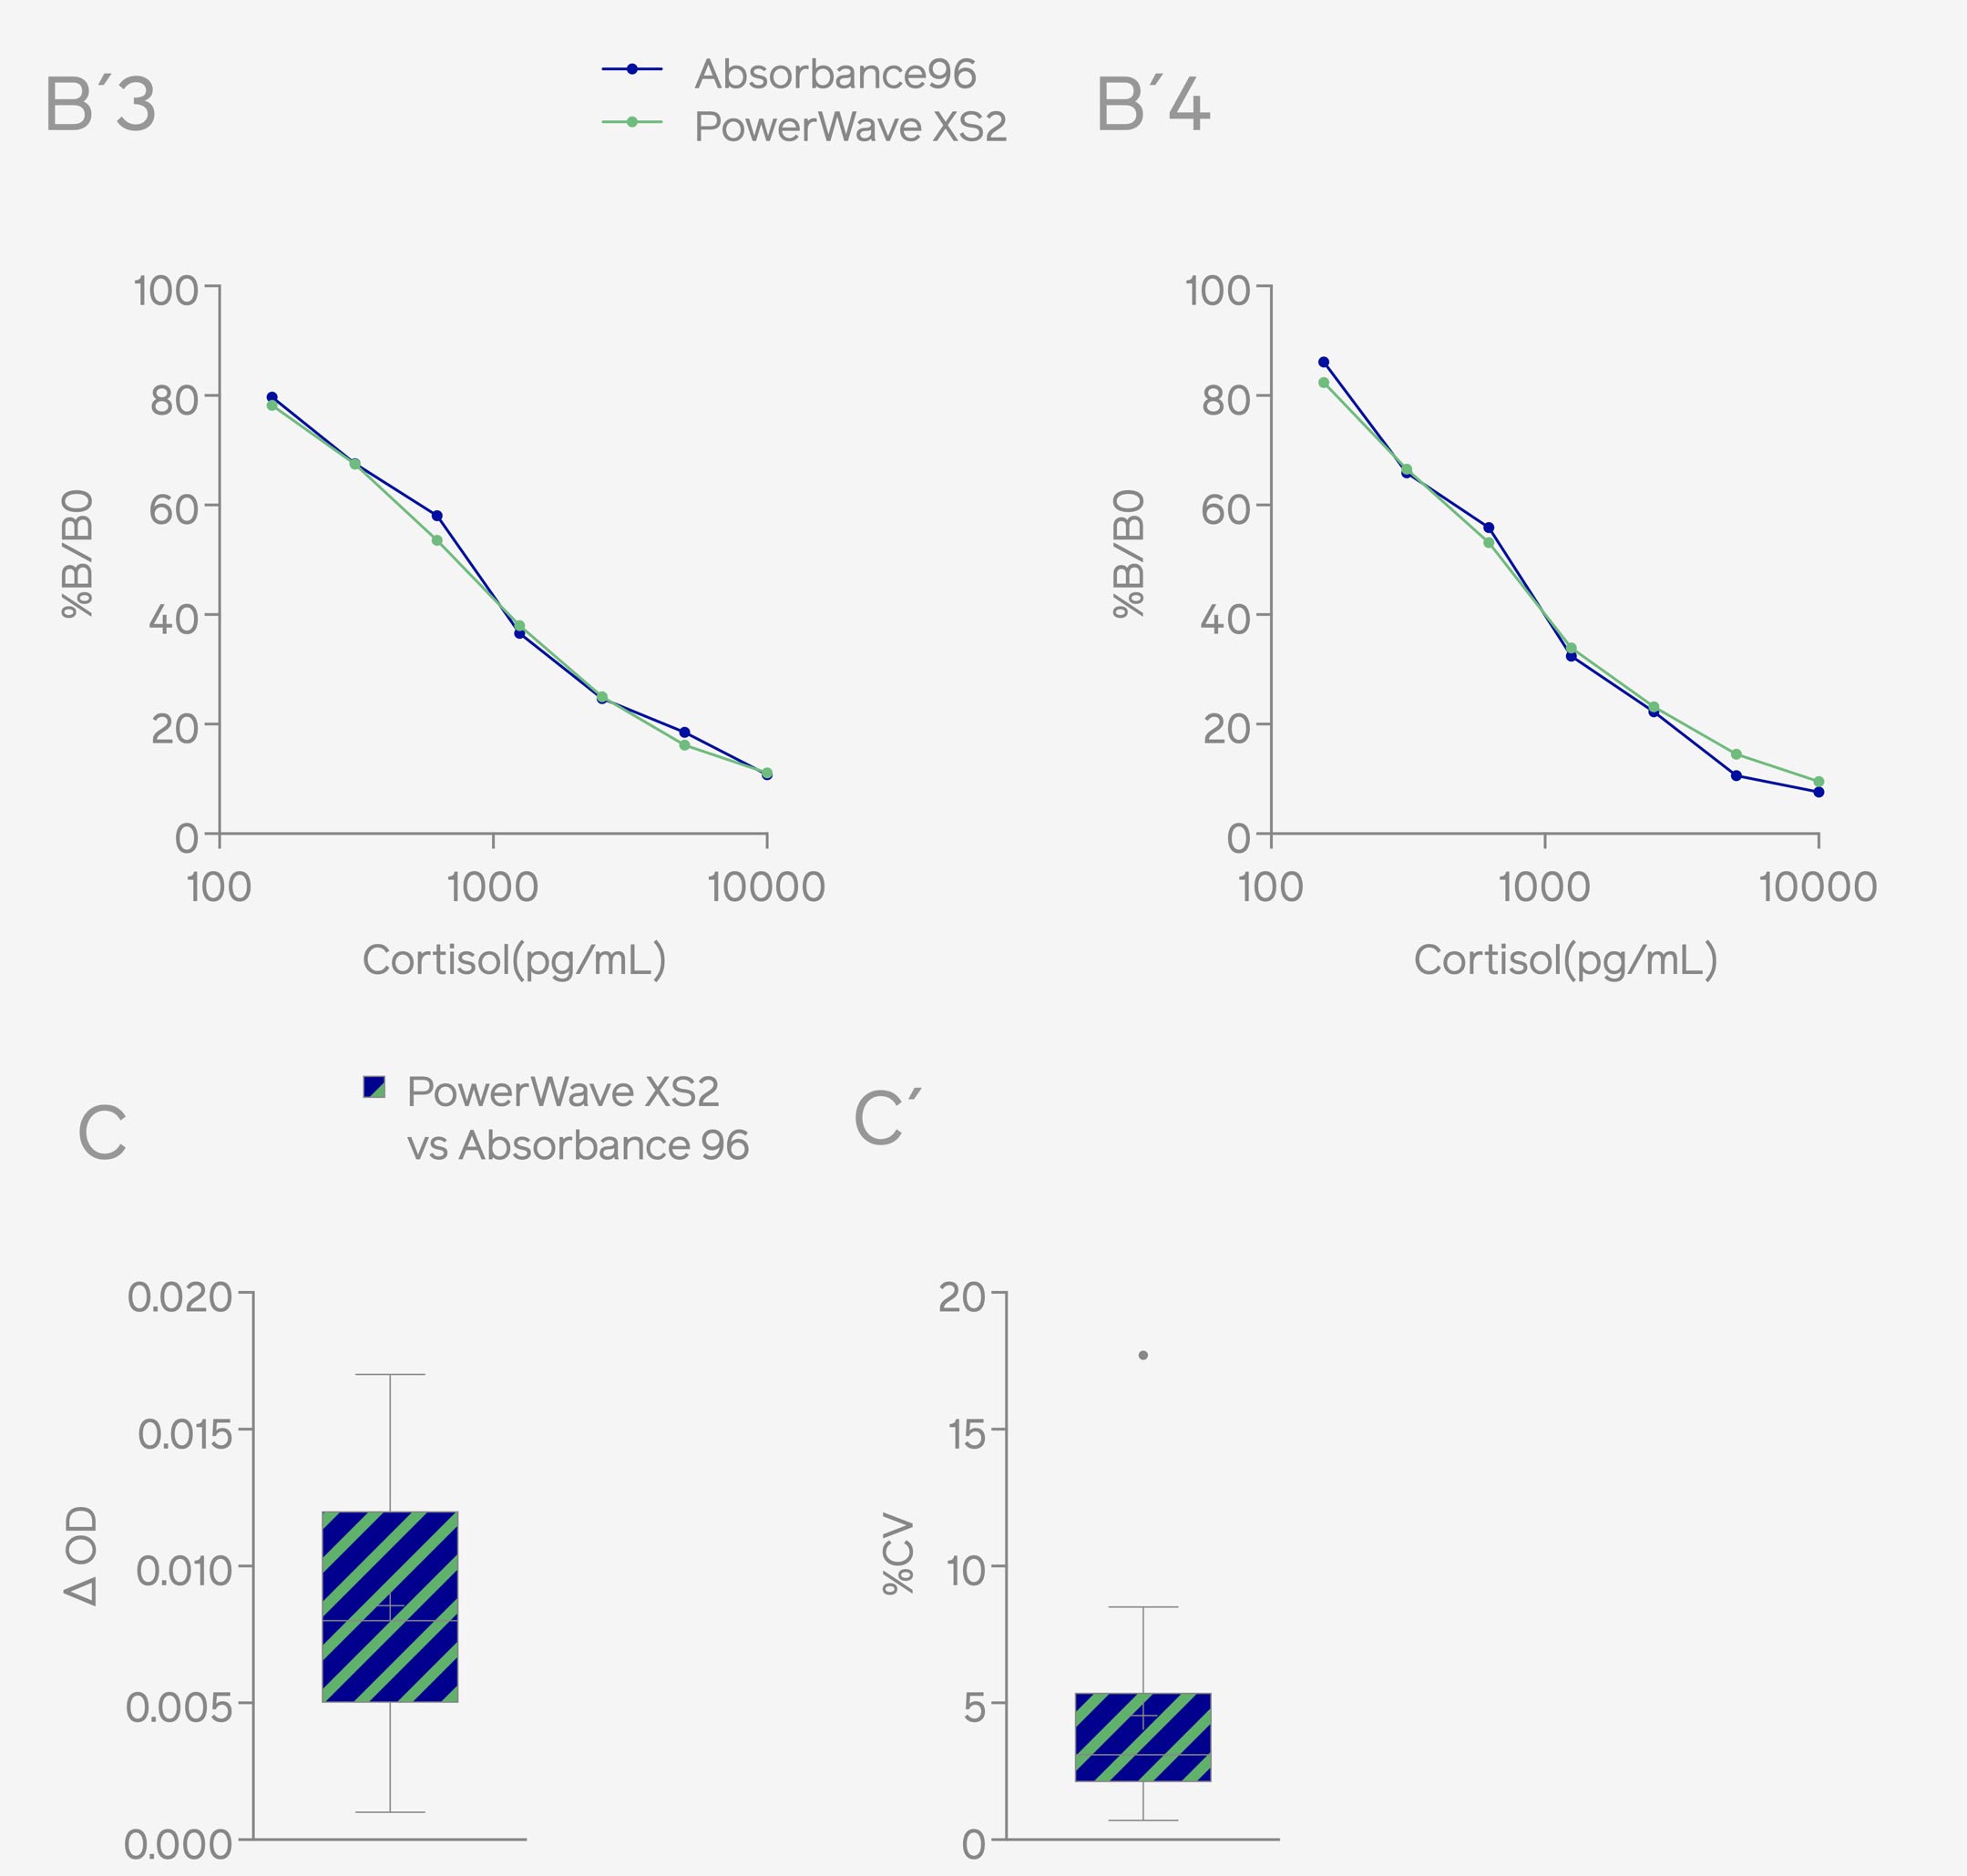
Figure 4: Intra- & Inter-Measurement Testing. Cortisol was carried out and resulting plates were measured twice with either device. (A/A’) Variation between repetitive reads within one device as well as the variation of the average of two measurements between both devices. Deviation of blank-corrected measurements depicted as (A) ΔOD or (A’) %CV. (B/B’) Four standard curves were generated and measured with either device. (B) Measured OD or (B’) B/B0 values are plotted against known standard concentrations. (B’-1 to B’-4) Each B/B0 standard curve is measured with either device shown separately for comparison. (C/C’) Variations of the obtained standard values between both devices are depicted as (C) ΔOD or (C’) %CV Boxplot data is depicted as a box-and-whisker plot. The midline shows the median, the box indicates the inner-quartile range (IQR) from the first to the third quartile, the whiskers indicate +/- 1.5xIQR, and the dots show outliers.
Consistent and reliable standard curves are vital for reliable and meaningful ELISA results. Standard curve acquisition was comparable between Absorbance 96 and PowerWave XS2 (Fig. 3-4, B-C). B/B0 values determining a sample's ratio to the assay's maximum binding capacity is a useful metric tool for analyzing competitive ELISA assays. B/B0 variation testing was performed by measuring a single Aldosterone ELISA plate in either device (Fig. 5), determining B/B0 values for each duplicate of samples, and analyzing variance of obtained B/B0 values between reads, either repetitive reads in one device or reads across different devices. Variation between obtained B/B0 values for all samples on the plate was very low, and B/B0 values obtained with each device deviated on average only about 1%CV.
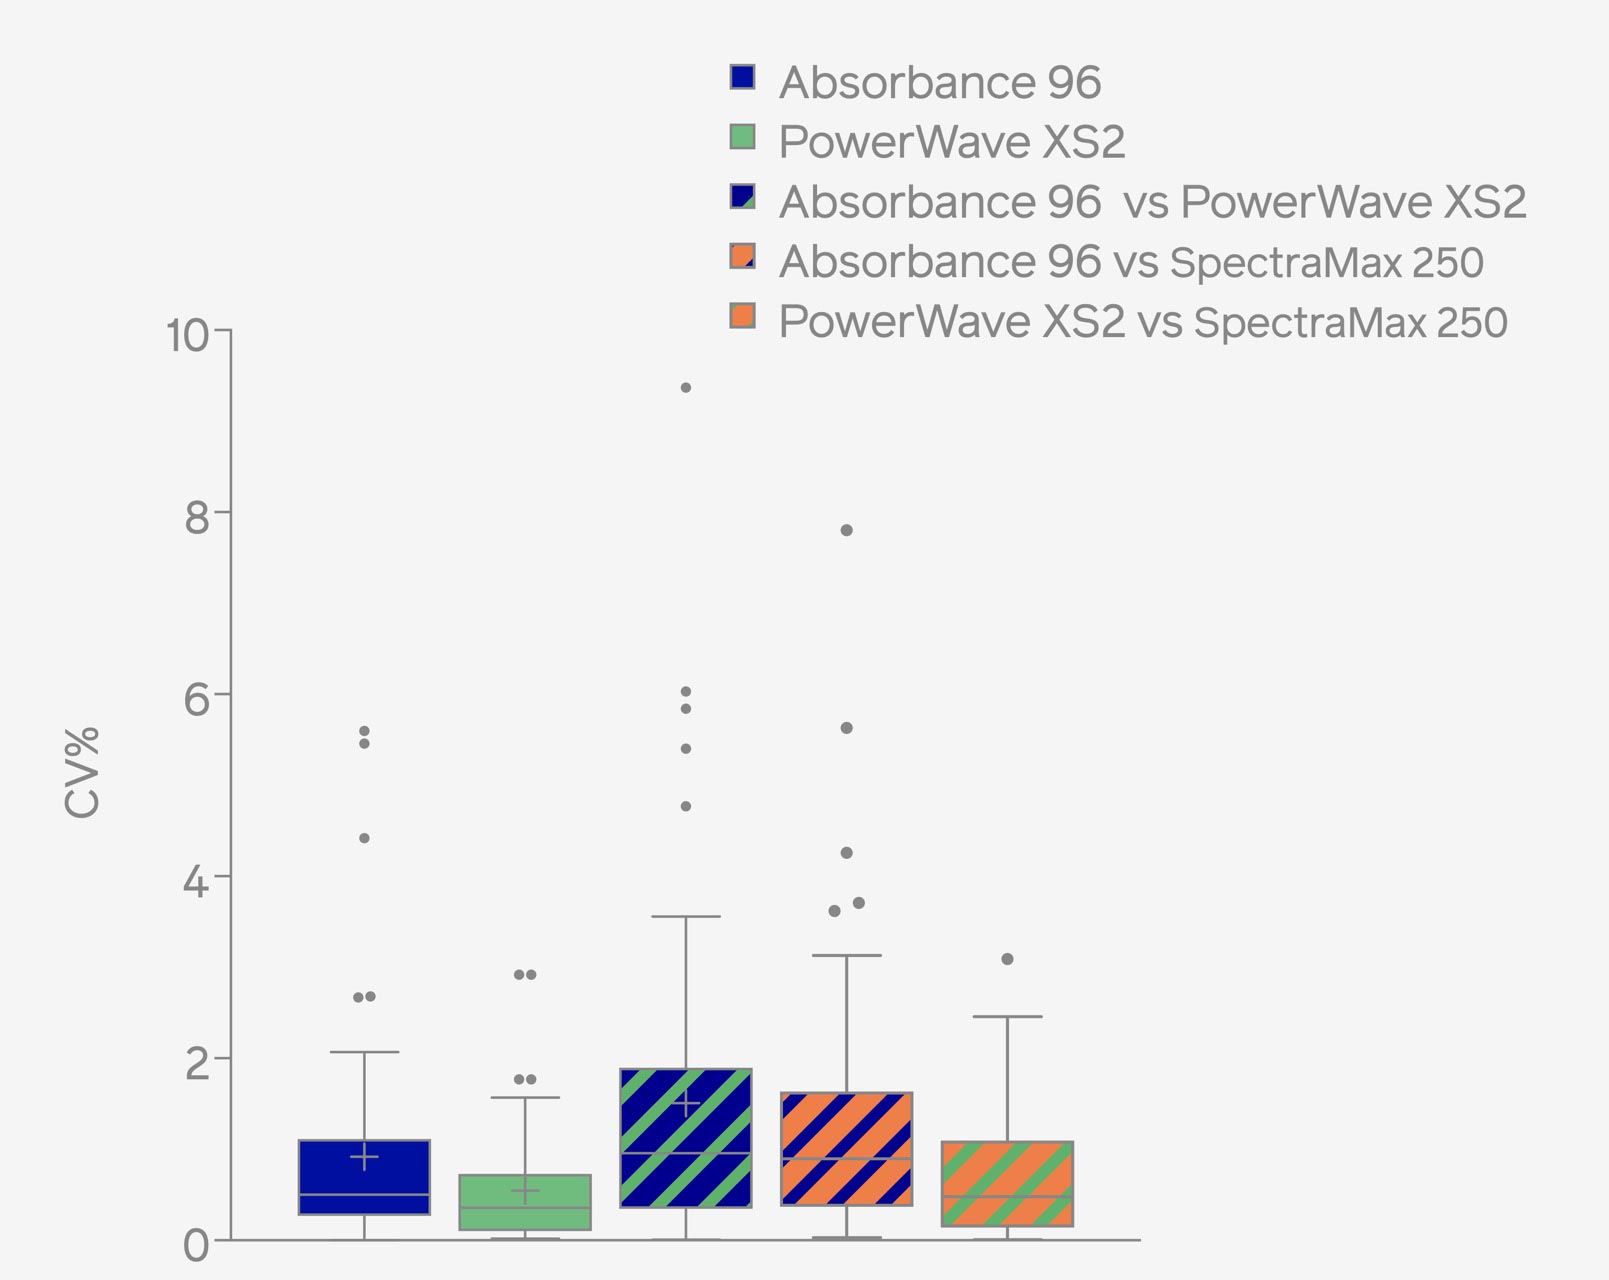
Figure 5: B/B0 Variation Testing. Aldosterone ELISA was carried out and the obtained plate was measured in each plate reader device. B/B0 values of sample duplicates were determined for each measurement run. Spread of %CVs of B/B0 are depicted as (A) %CV between two measurements. Boxplot data is depicted as a box-and-whisker plot. The midline shows the median, the box indicates the inner-quartile range (IQR) from the first to the third quartile, the whiskers indicate +/- 1.5xIQR, and the dots show outliers.
Conclusion
This study yielded no significant differences in performance between the Absorbance 96 ELISA reader and conventional benchtop microplate readers. These findings highlight that a compact and portable ELISA reader, exemplified by the Absorbance 96 ELISA reader can serve as a functionally equivalent alternative to benchtop plate readers across a comprehensive spectrum of research applications. Notably, the Absorbance 96 ELISA reader exhibits excellent compatibility with a broad range of Enzo’s ELISA kits and offers unparalleled utility in small or field-based laboratory settings.
Additionally, results showed that the Absorbance 96 ELISA reader seemingly recorded observationally higher variation in most tests and a slightly increased noise ratio, although no statistically significant differences were found. Consequently, for the vast majority of practical applications, these differences are presumed to be irrelevant. To maximize precision for extremely sensible data, assays may be read in triplicates with the Absorbance 96 ELISA reader instead of the commonly used duplicates, especially for samples at relatively low optical density (OD) values.
Materials and Experimental Outline
Materials
PowerWave XS2 (BioTek Instruments), SpectraMax 250 (Molecular Devices), TMB (ADI-90-0350: Enzo Life Sciences), Mouse IgG2b-HRP Conjugate (ADI-80-1003: Enzo Life Sciences), IgG2b (mouse), ELISA kit (ADI-900-110: Enzo Life Sciences), TNF-α (mouse), ELISA kit (ADI-900-047: Enzo Life Sciences), Cortisol ELISA kit (ADI-900-071: Enzo Life Sciences), Aldosterone ELISA kit (ADI-900-173: Enzo Life Sciences)
Precision testing
TMB Substrate was developed in a pooled batch by mixing with mouse IgG2b-HRP Conjugate. The developed substrate was aliquoted onto 80 wells of a 96-well plate evenly. The plate was measured in three devices: Absorbance 96, PowerWave XS2 & SpectraMax 250, results were corrected against a blank well.
Intra- and inter-measurement variation testing
IgG2b (mouse), TNF-α (mouse), and Cortisol ELISA were carried out according to the manufacturer’s recommendation. Plates were measured in two devices: Absorbance 96 & PowerWave XS2. Duplicate measurements were run with the same plate and obtained values were corrected against blank wells.
B/B0 variation testing
Aldosterone ELISA was carried out according to the manufacturer’s recommendation. The plate was measured using Absorbance 96, PowerWave XS2 & SpectraMax 250. Samples were run in duplicates, and the plate was read in all three devices. Afterward, the plate was measured a second time with Absorbance 96 & PowerWave XS2. All values were NSB-corrected.